
Ready-made widgets
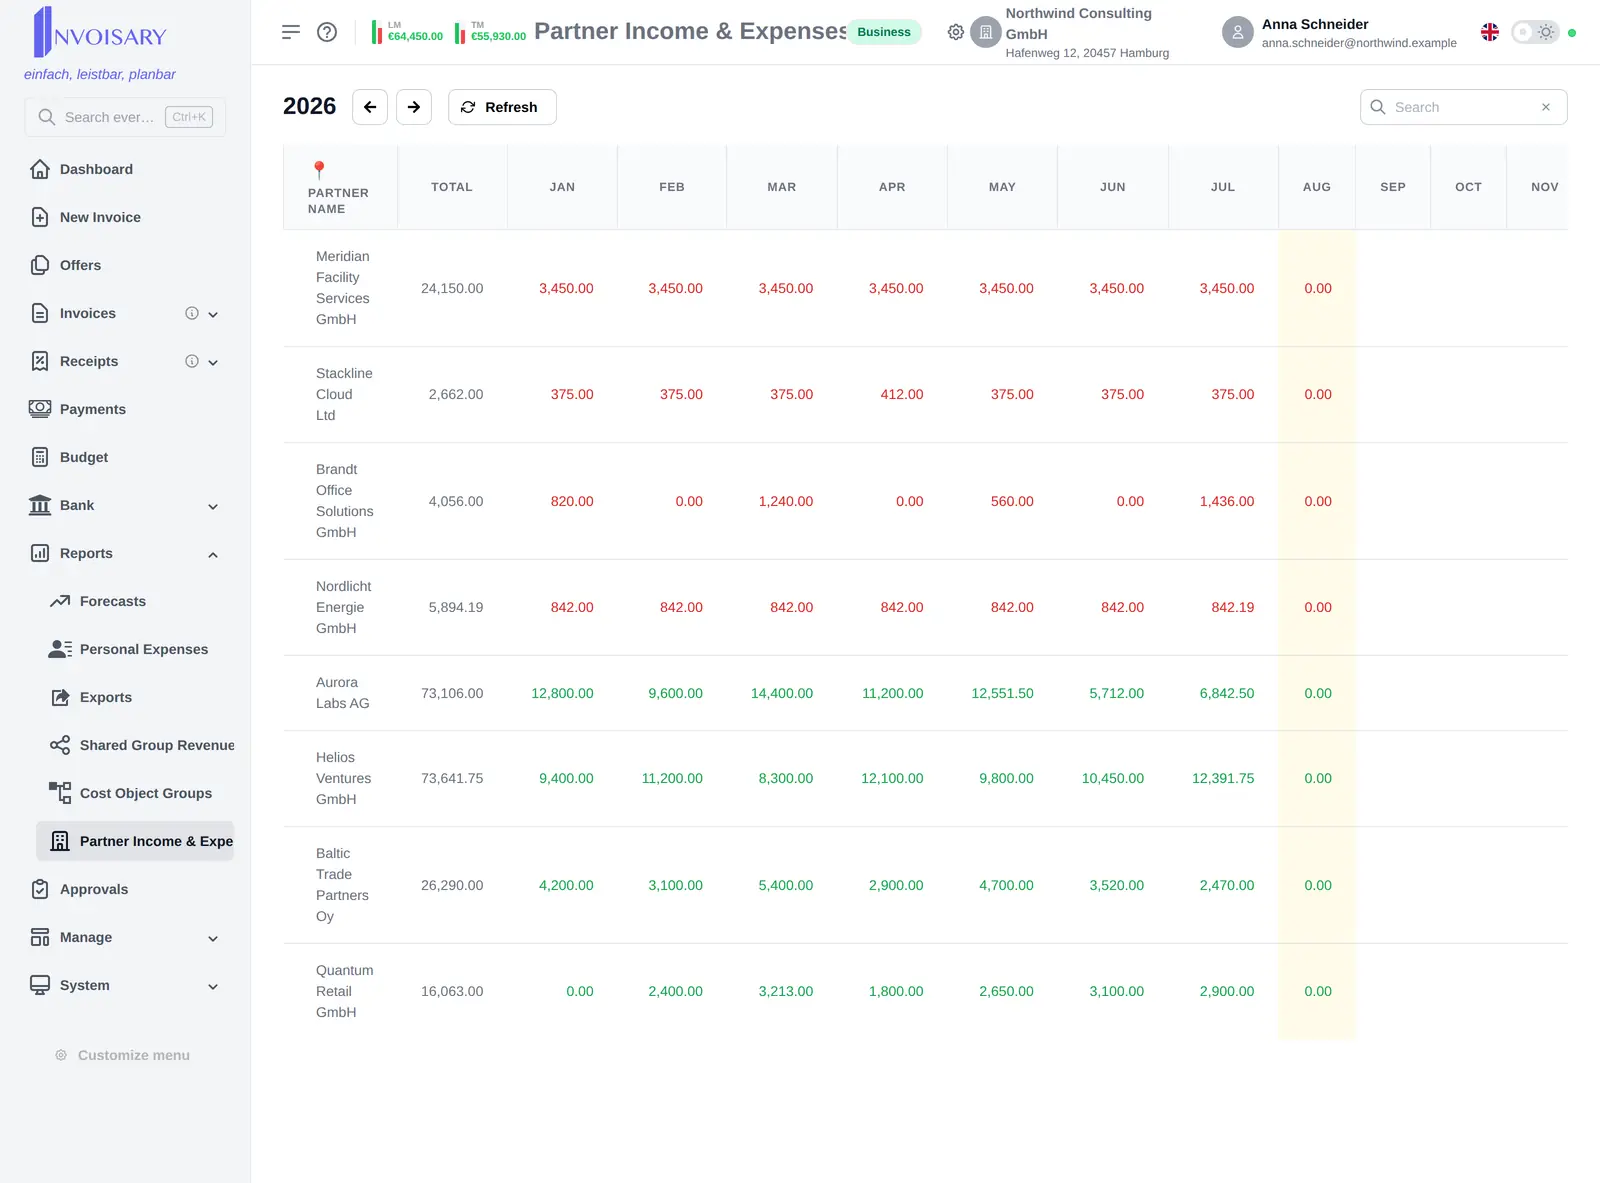
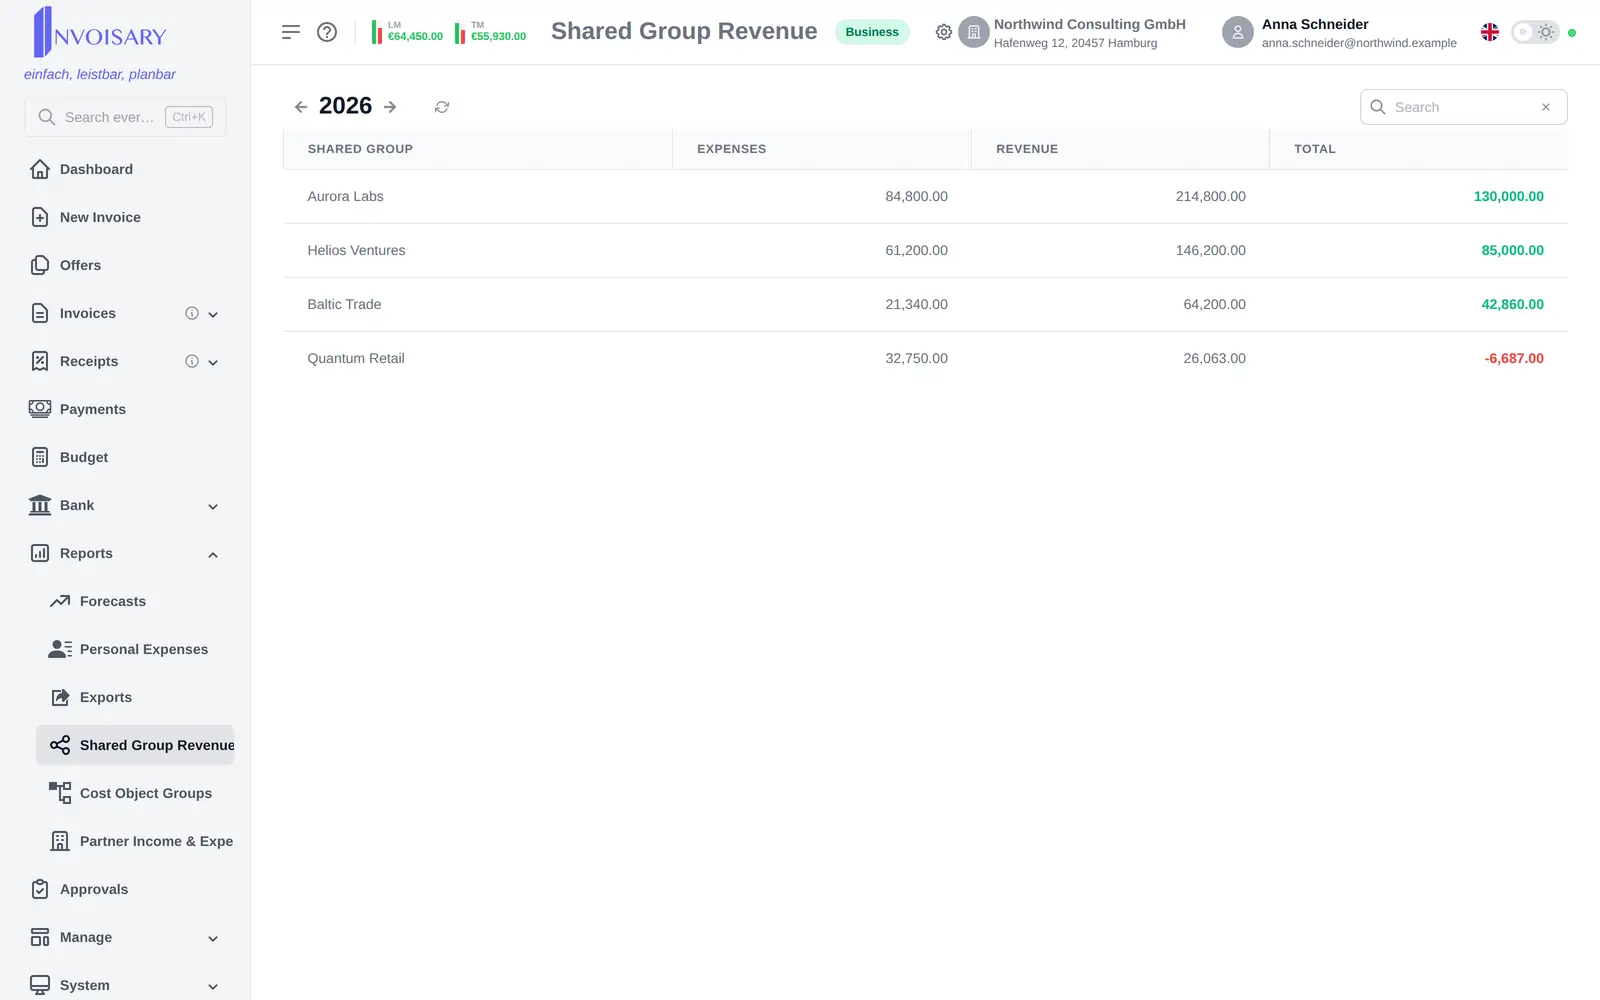
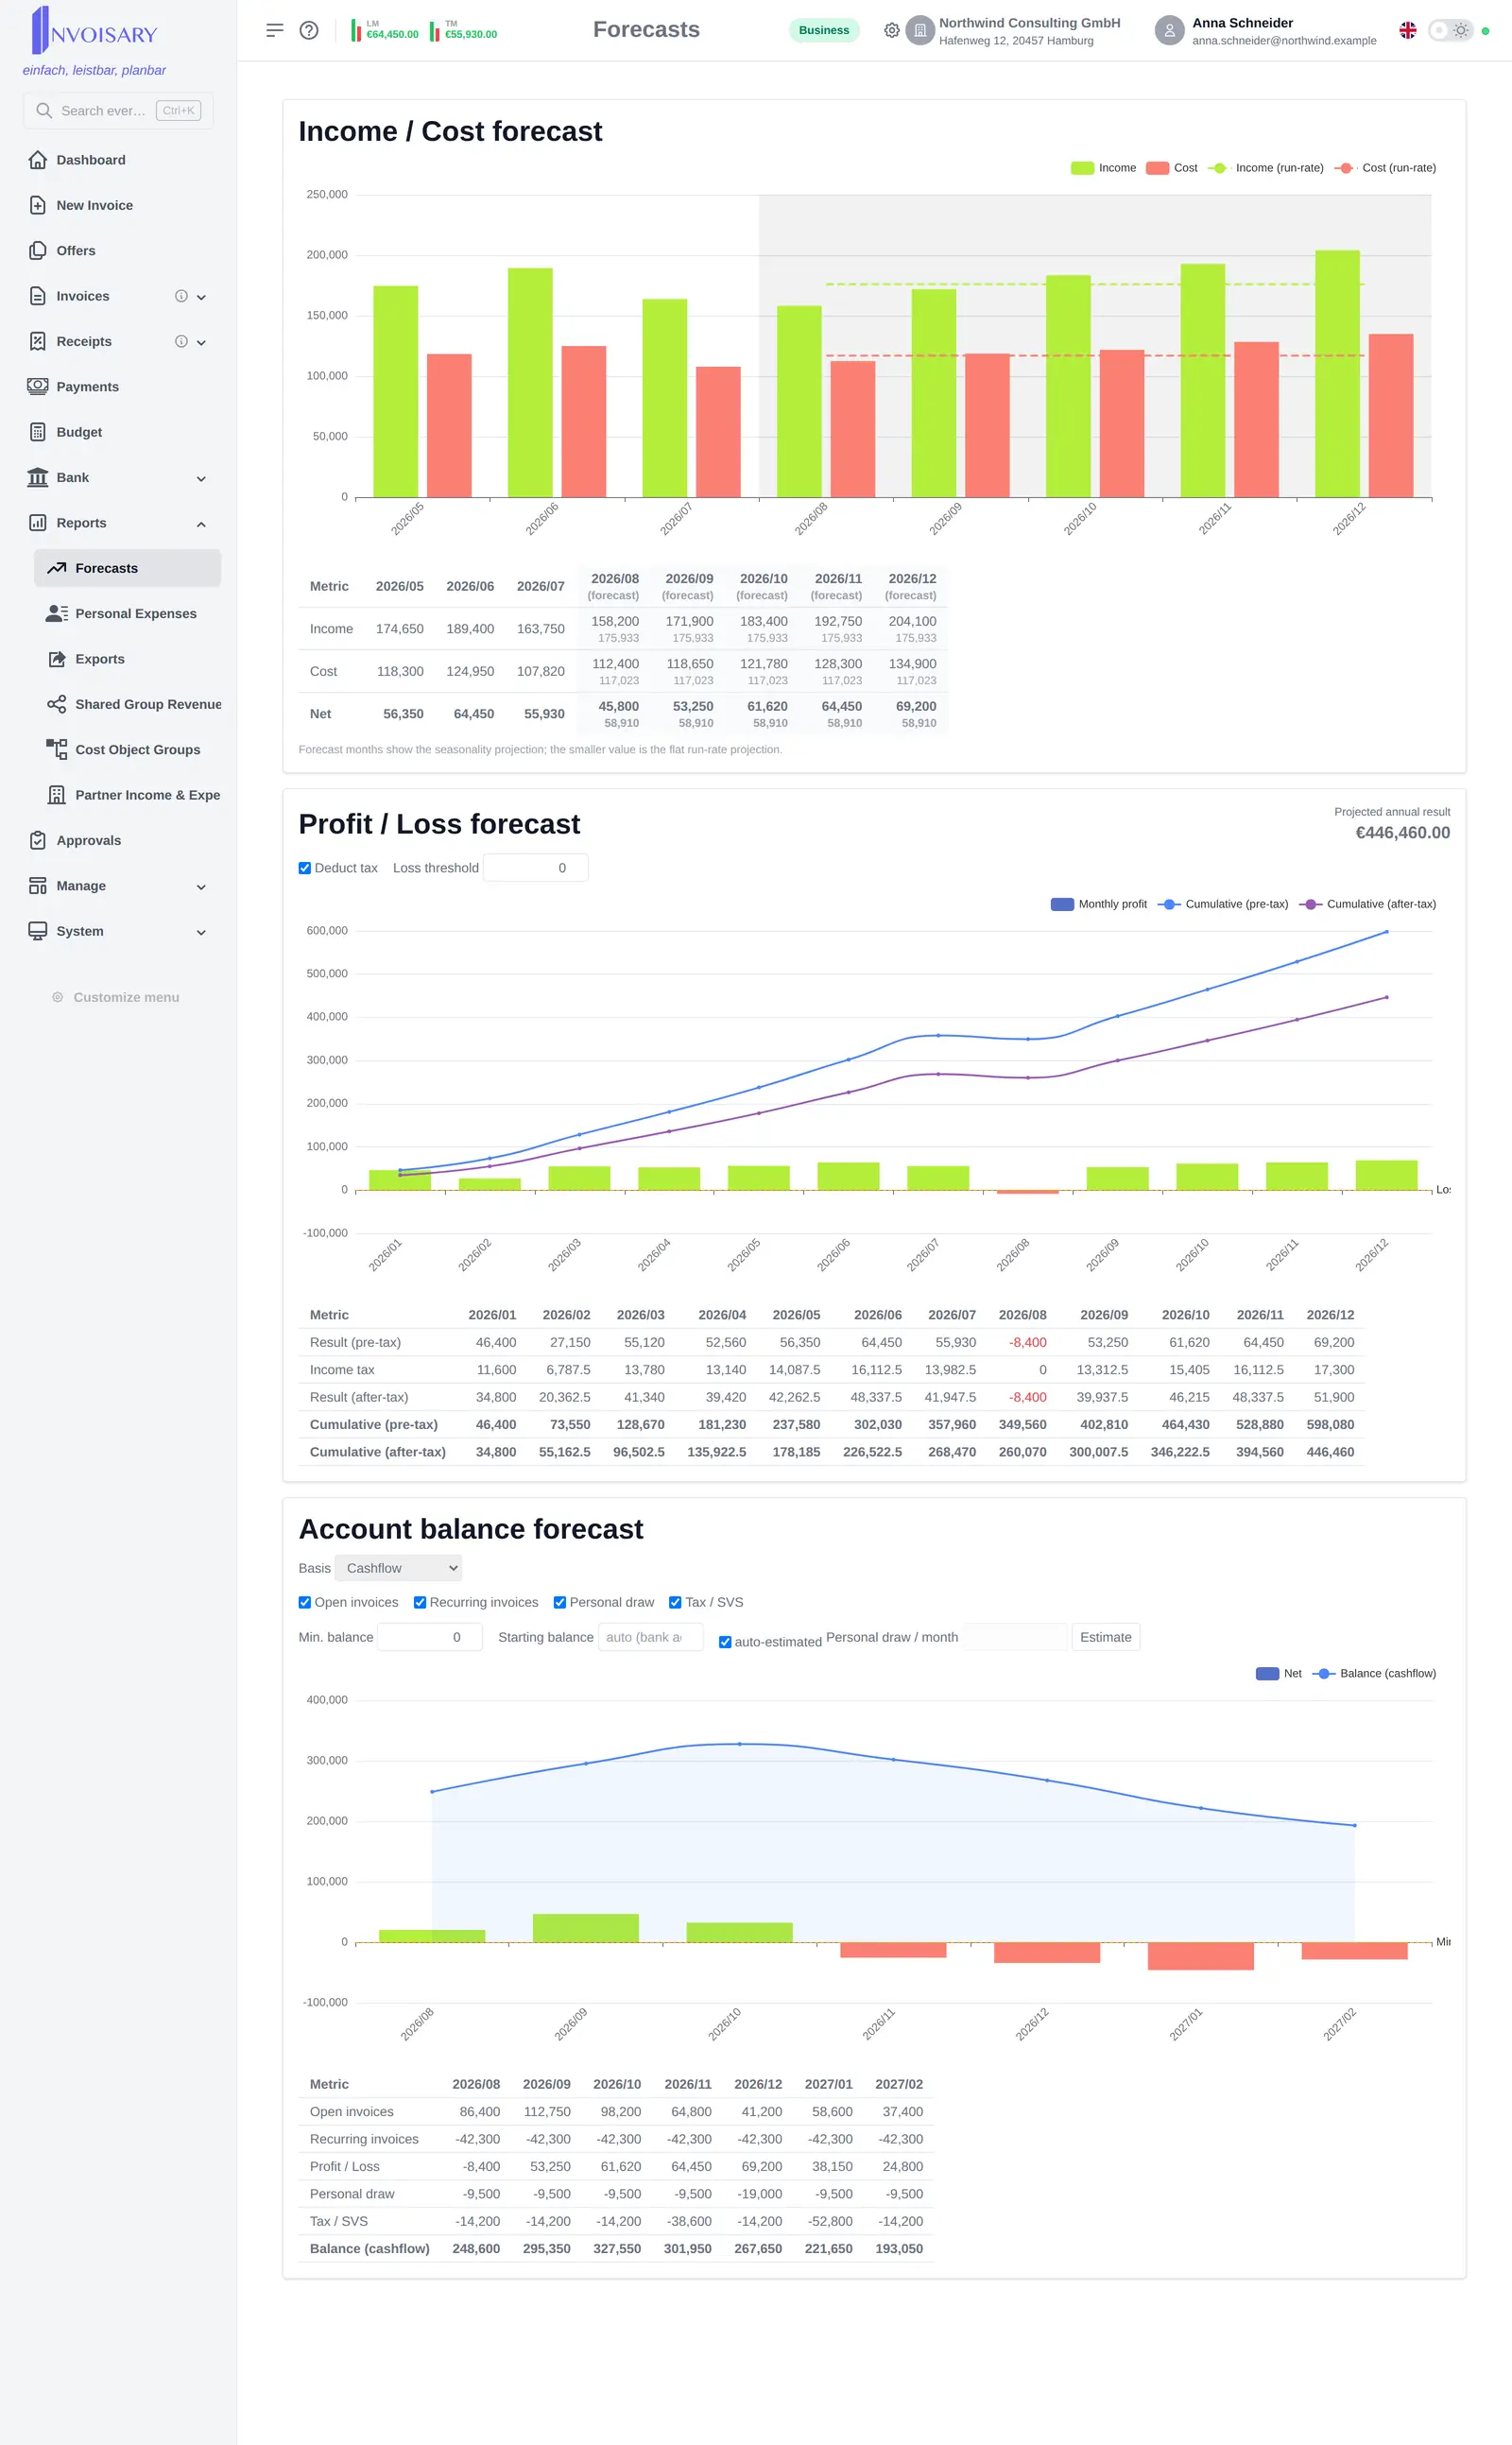
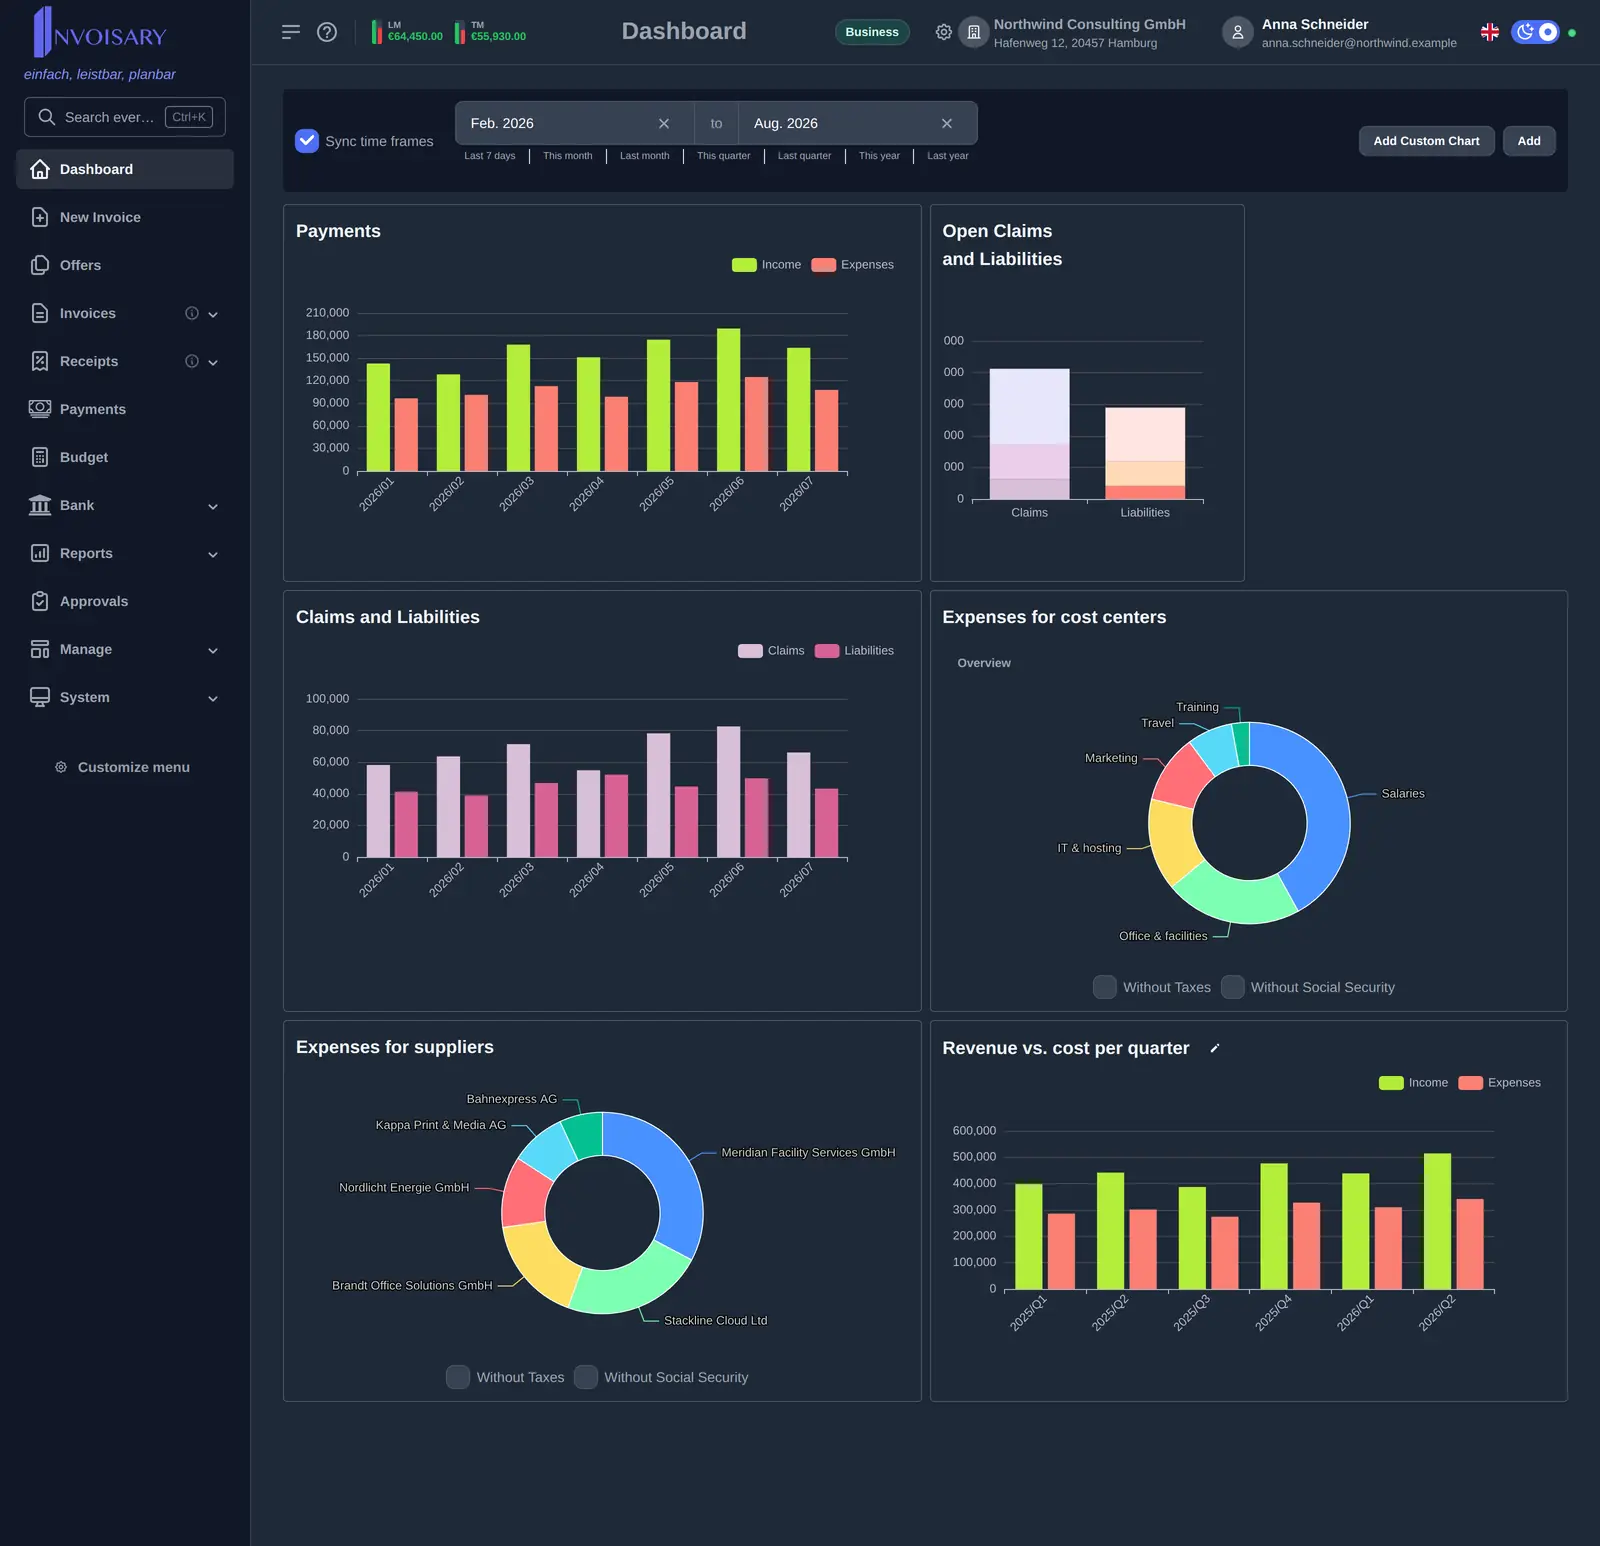
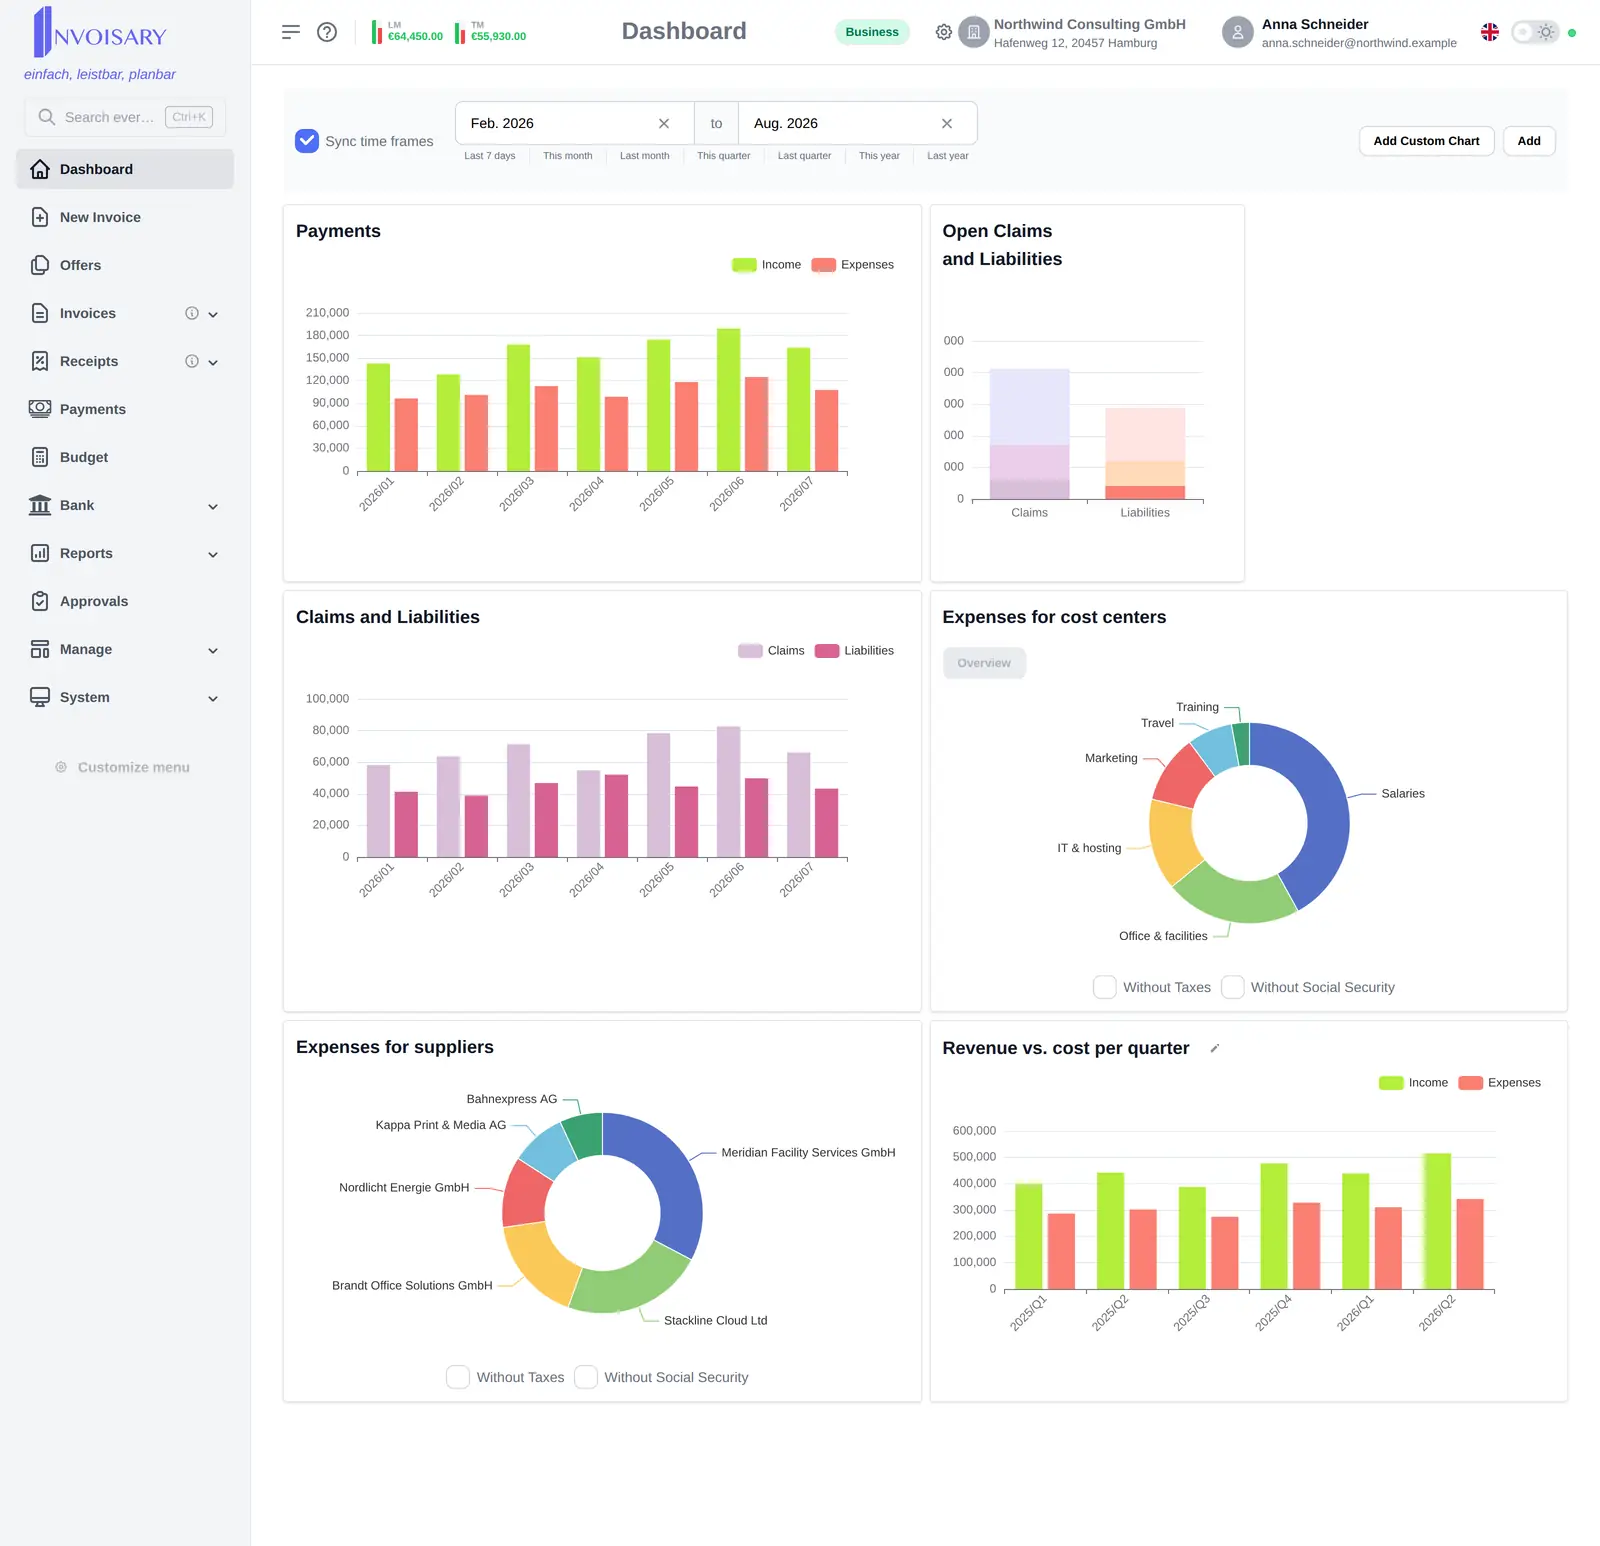
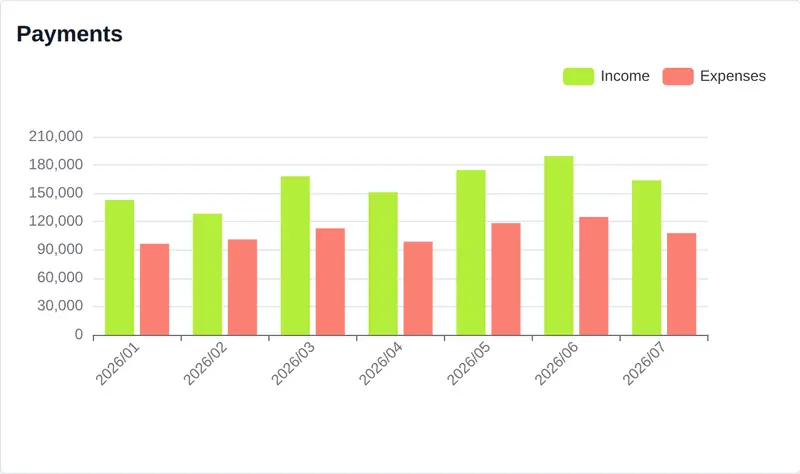
Income versus expenses, claims and liabilities over time, open amounts by due date, expenses by supplier, cost center, cost object and shared group.
Reporting
The dashboard is composed from widgets. A shared date range drives every tile, optionally synchronized across all of them.
What is included
Compose your own dashboard from widgets and extend it with charts you define yourself.
Income versus expenses, claims and liabilities over time, open amounts by due date, expenses by supplier, cost center, cost object and shared group.
Add bar, line, area or pie charts with their own data source, date range and interval from daily through yearly.
This or last month, quarter or year, or a custom period. Cost-center and cost-object charts drill down from overview into detail.

Invoisary. Invoices, expenses, and budgets in one workflow.